Download here: Ontario Curriculum Expectations
No one has a right to sit down and feel hopeless. There is too much work to do.
Dorothy Day
We use motion graphs in Physics in order to get a visual interpretation or �picture� of an object’s (car, person, ball, etc.) motion over a period of time. We also use them to establish trends and make predictions about an object’s motion that we would not be able to do with just a data table or description.
This is an example of a position-time (d-t) graph of a person walking. From a d-t graph, we can find:the person’s position at any point in timethe person’s velocity
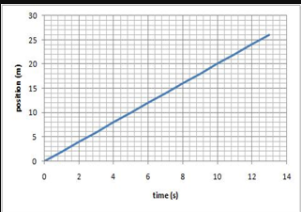
Finding position from a d-t graph
How far has the person walked in 8 s? To answer this, we find the time of 8 s on the time axis and draw a line upwards until it hits the graphed line. A second line is drawn horizontally until it reaches the position axis. This point on the position axis tells us how far the person has walked from the origin in 8 s. In this case, it is 16 m.
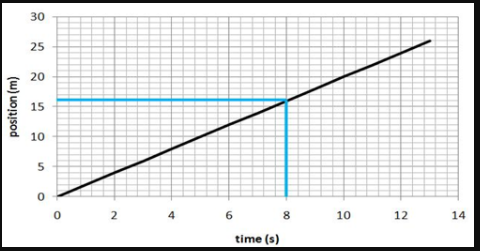
How far is the person from the origin after 4s? After 12 s?
Highlight this box with your mouse to see if your answers are correct After 4 s the person has walked 8 m. After 12 s the person has walked 24 m.
Finding velocity from a d-t graph
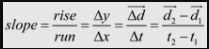
The velocity of an object is equal to the slope of the d-t graph. To calculate slope, we need to choose two points that are on the graph and number them 1 and 2 (either number can be assigned to either point). The further apart the two points are, the more accurate the calculation will be. The coordinates can then be substituted into the velocity equation.

Therefore,
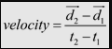
We can now calculate the speed of the walker.
Point 1 has the coordinates (2, 4). Point 2 has the coordinates (12, 24). Substituting into our velocity equation we get:

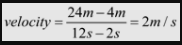
The velocity of the walker is 2 m/s.
If we had numbered our points differently, point 1 would have the coordinates (12, 24) and point 2 would have the coordinates (2, 4). Substituting into our velocity equation we would get:
which is the same answer.
It is not necessary for a position-time (d-t) graph to always start at the point (0, 0) nor does the graph have to always go up and to the right. A line going down and to the right has a negative slope which indicates that the object is moving backwards or back towards the origin. A straight horizontal line has a slope of zero and indicates that the object is not moving.
Practice Questions
- Calculate the slope of each of the three lines on the graph.What relationship do you notice between the steepness of the graph and the velocity of the object?

Answer
The first line (red) has a slope of 1.5 m/s.
The second line (blue) has a slope of 0.5 m/s.
The third line (green) has a slope of -1 m/s.
You should have noticed that the steeper the slope of the graph, the greater the velocity.
Interpreting Position-Time Graphs
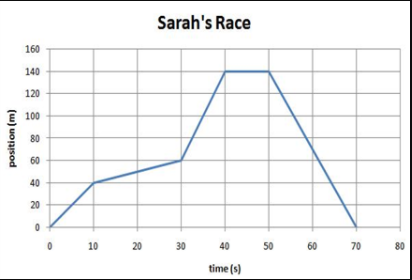
Sarah is competing in a race where she must run 40 m, pick up and carry a large sack of potatoes for 20 m, sprint another 80 m to the �turn around point’, tie her shoe lace, and then run back to the starting line. Her motion is plotted in the graph to the left.
Practice Questions
- Use the graph of Sarah’s Race to answer the following questions
- During which interval was Sarah travelling the fastest? (Give the time interval)
- What was her total displacement?
- What was her average velocity from the start of the race to the �turn around point’?
- What is the total distance she has run?
- What was her average speed for the entire race?
- What is her average velocity for the entire race?
Answer
- We can find velocity from a d-t graph by calculating the slope of the line. The line with the steepest slope will be the one where Sarah is running the fastest. This will be the section between t = 30 s and t = 40 s.
- Displacement is the straight line distance between where an object starts and where an object ends its motion. In this case, Sarah starts and ends in the same place. Therefore, her displacement is 0 m.
- To calculate the average velocity, place a point at the starting point and the end point of the range over which you are calculating the average velocity (in this case it will be between t = 0 s and t = 40 s). Then draw a line between the two endpoints and find the slope of the line.

- The total distance is the sum of the distances of each line segment. ?d = 40 + 20 + 80 + 140 = 280 m.
- Her average speed is
 .
. - Her average velocity is 0 m/s since her displacement is 0 m (from question B).