MCV4U: Calculus & Vectors
-
Course Outline
Course Outline -
Unit 1: Rates of ChangeLesson 1: Reviewing prerequisite skills1 Quiz
-
Lesson 2: Determining rates of change1 Quiz
-
Lesson 3: Determining limits1 Quiz
-
Lesson 4: Using first principles to determine the equation of a tangent1 Quiz
-
Unit 2 : DerivativesLesson 5: Finding derivatives (part A)1 Quiz
-
Lesson 6: Finding Derivatives (Part B)1 Quiz
-
Lesson 7: Solving Related Rates Problems1 Quiz
-
Lesson 8: Investigating velocity, acceleration and second derivatives1 Quiz
-
Unit 3 : Curve SketchingLesson 9: Exploring the first derivative1 Quiz
-
Lesson 10: Exploring the second derivative1 Quiz
-
Lesson 11: Sketching curves: part A1 Quiz
-
Lesson 12: Sketching curves: part B1 Quiz
-
Unit 4 : ExtensionsLesson 13: Solving optimization problems1 Quiz
-
Lesson 14: Working with sinusoidal functions1 Quiz
-
Lesson 15: Working with exponential and logarithmic functions1 Quiz
-
Unit 5 : VectorsLesson 16: Using Geometric Vectors1 Quiz
-
Lesson 17: Investigating Cartesian vectors1 Quiz
-
Lesson 18: Exploring vectors in 3-space1 Quiz
-
Lesson 19: Creating equations of vectors1 Quiz
-
Lesson 20: Investigating lines and planes1 Quiz
Notice: Undefined offset: 0 in /home/forge/cilearning.ca/web/app/themes/buddyboss-theme/learndash/ld30/learndash-sidebar.php on line 143
Notice: Trying to access array offset on value of type null in /home/forge/cilearning.ca/web/app/themes/buddyboss-theme/learndash/ld30/learndash-sidebar.php on line 143
Lesson 3: Average & Instantaneous Rates of Change
Average Rate of Change
The table shows the results of a student recording temperature every 3 s.
| Time(s) | Temperature (F) |
| 0 | 66.756 |
| 3 | 89.330 |
| 6 | 91.544 |
| 9 | 92.678 |
| 12 | 93.542 |
| 15 | 94.010 |
| 18 | 94.496 |
| 21 | 94.550 |
How can you estimate the rate of change of temperature at exactly 15 s?
A closer look at the temperatures in the table shows that for every 3 s the temperature is recorded from 0 to 21 s to the nearest thousandths. The temperature amounts are increasing but are not a constant rate between time intervals.
In other words, the rate of change of temperature is different for different intervals.
The table below shows the first difference and the average rate of change for each 3 s interval.
The average rate of change appears to decrease as time increases. The average rate of change is from 12 to 15 s and the average rate of change is
from 15 to 18s. So it is difficult to estimate the rate of change at exactly 15 s, however, a sequence of average rates of change can be used to estimate the rate of change at an exact time.
Solution:
b. The time interval is 1< t > 2.
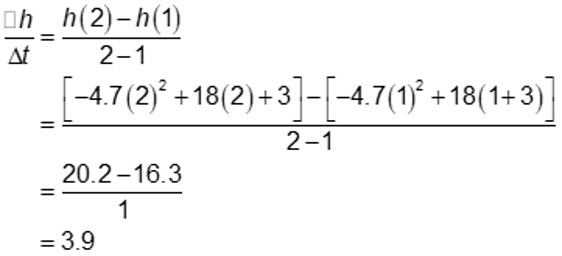
The average rate of change of height with respect to time is 3.9 m/s during the 2nd second of the model’s flight.